And does FinCEN have a 95 percent “false positive rate” it needs to address?
The U.S. election is Tuesday, November 3rd. We’ll know soon thereafter whether the country will have a new Democratic Joe Biden administration or whether the current administration under Republican Donald Trump will continue for a second term. And we’ll also know whether the Senate stays with a Republican majority or flips and goes Democratic (control of the House of Representatives will likely remain with the Democrats).
Financial crimes professionals are asking about what a change in administration could mean for them. Let’s look at recent trends in four different aspects of financial crimes compliance: (i) the number of Suspicious Activity Reports (SARs) filed, (ii) the number and types of federal criminal cases, (iii) the number of Deferred Prosecution Agreements (DPAs) entered into by corporations, and (iv) referrals to FinCEN made by federal agencies for substantial potential BSA violations.
We will look at the period 2011 through 2019. The recent FinCEN Files investigation and articles from Buzzfeed News and the International Consortium of Investigative Journalists (ICIJ) used leaked SARs that had been filed from 2011 through 2017 (actually, there were also about 10 SARs a year from each of 2008, 2009, and 2010, but journalists haven’t focused on those, likely because they don’t reveal enough salacious information to fit their narrative). And 2019 is the last full year (federal government fiscal year running through September 30) that has available data. Also, this nine-year period includes the last four years of the Democratic Obama administration and the first two full years of the Republican Trump administration. So we can compare the two to see if there are any differences or trends.
Caveat/Disclaimer – the Trump administration took power on January 21, 2017, almost four months into the 2017 fiscal year. In fairness to that administration, I have only used fiscal years 2018 and 2019 as being “Trump” years, and have described these years as the first two full years of this administration.
I. SAR Filing Trends Compared to Federal Criminal Cases
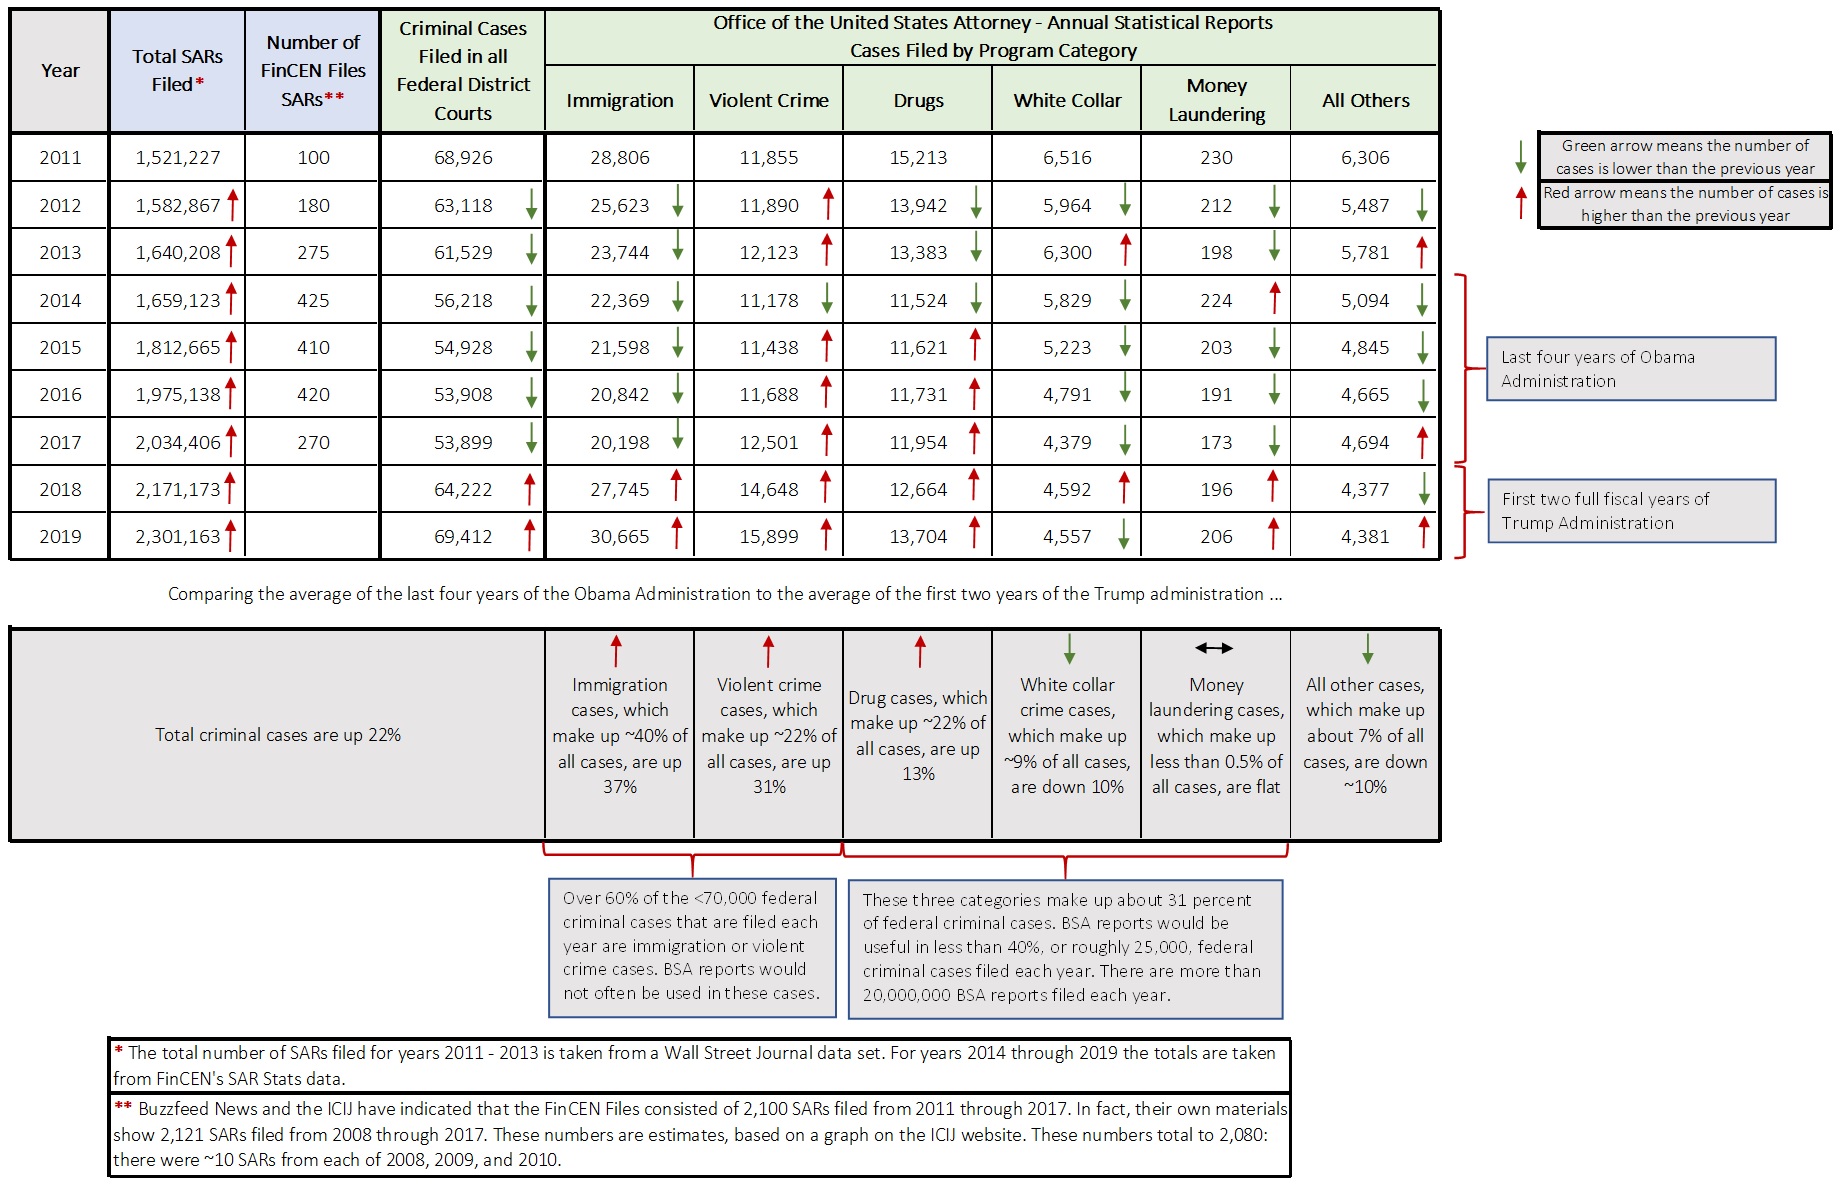
The image below is complicated and contains a lot of data and information. First, the main table with the grey, blue, and green column headings: the blue headings show the total number of Suspicious Activity Reports (SARs) filed each year from 2011 through 2019. The red arrows in the cells indicate that the number in that cell (year) is higher than the number in the prior year. As can be seen, the number of SARs filed goes up every year.
The total number of SARs filed is compared to the number of FinCEN Files SARs. As explained in the ** note below the chart, Buzzfeed News has a chart that allows you to estimate the number of SARs it had by year. I include this to show that the FinCEN Files SARs are a very small proportion of the total SARs filed: that alone should convince a reader that the FinCEN Files SARs are not representative of all SARs filed.
The green columns show data from the Office of the United States Attorney’s Annual Statistical Reports. The first green-header column shows the total number of criminal cases filed in all Federal District Courts. As can be seen by the arrows, the total number of criminal cases dropped every year 2012 through 2017, then rose significantly in 2018 and again in 2019. As indicated, 2014 through 2017 are the last four years of the Obama administration: 2018 and 2019 are the first two full fiscal years of the Trump administration.
The next six columns break out the criminal cases by the DOJ program categories. I selected the four largest (by total number of cases) categories – immigration, violent crime, drugs, and white collar crime – as well as Money Laundering (being of obvious interest to financial crimes compliance professionals) and then all others.

Immigration Cases – these cases make up about 40 percent of all federal criminal cases. Comparing the average of the last four years of the Obama administration with the average of the first two years of the Trump administration, immigration cases are up about 37 percent under Trump. And where these cases trended down every year under the Democratic administration, they are up both years under the Republican administration.
Violent Crime Cases – these cases make up about 22 percent of all federal criminal cases. Comparing the average of the last four years of the Obama administration with the average of the first two years of the Trump administration, violent crime cases are up about 31 percent under Trump.
Observation: Over 60 percent of federal criminal cases are immigration or violent crime cases. It is unlikely that BSA reports would play a major part in the identification, investigation, or prosecution of these types of cases, which appear to be a focus of the Trump administration.
Drug Cases – these cases make up about 21 percent of all federal criminal cases. Comparing the average of the last four years of the Obama administration with the average of the first two years of the Trump administration, drug cases are up about 13 percent under Trump.
White Collar Cases – these cases make up about 9 percent of all federal criminal cases. Comparing the average of the last four years of the Obama administration with the average of the first two years of the Trump administration, white collar cases are down about 10 percent under Trump. However, the trends are more complicated than the averages: white collar cases dropped every year for the last four years of the Obama administration, from a high of 6,300 in 2013 down to 4,379 in 2017. The numbers are only slightly higher under the Trump administration at ~4,600 each year.
Money Laundering Cases – there is no real trend in these cases other than very few are brought. I have included this category of cases to illustrate the difference between suspicious activity, which is what financial institutions are required to report to the federal government, and the crime of money laundering. For every 10,000 SARs and 100,000 BSA reports, the federal government brings 1 money laundering case.
Over 30 percent of federal criminal cases involve drug crimes, white collar crimes, or money laundering. It is likely that BSA reports play a major part in the identification, investigation, or prosecution of these types of cases.
So to summarize:
II. SAR Filing Trends Compared to Deferred Prosecution Agreements (DPAs)
If you were able to figure out the previous graphic, this next one should be a breeze. The website Corporate Prosecution Registry is maintained by a group at the University of Virginia. The website provides the following description:
The Corporate Prosecution Registry is a joint project of the Legal Data Lab at the University of Virginia School of Law and Duke University School of Law. The goal of this Corporate Prosecution Registry is to provide comprehensive and up-to-date information on federal organizational prosecutions in the United States, so that we can better understand how corporate prosecutions are brought and resolved. We include detailed information about every federal organizational prosecution since 2001, as well as deferred and non-prosecution agreements with organizations since 1990.
We aim to provide accurate, timely, and accessible information for policymakers, researchers and litigators alike. All of the information contained on this website is publicly available, and was gathered from federal docket sheets, press releases, prosecutor’s offices, as well as from FOIA requests.
The Registry was created by Professor Brandon Garrett ( bgarrett@law.duke.edu) and Jon Ashley ( jonashley@law.virginia.edu)). We welcome any questions or feedback about the contents or features of this website. Please tell us if you notice any errors or can add information about a case, or if you have information about a case that is missing from the Registry.
We want to encourage the broadest possible use of this data for research and educational purposes. We believe all of the primary documents collected here are works of the United States government and are therefore free of all copyright protection, per Section 105 of the U.S. Copyright Act. To promote access and reuse of the database, which may be subject to limited copyright protection or other legal protections, we have licensed the data for free public use under the Creative Commons Attribution-NonCommercial 4.0 International License. Please attribute the database as indicated above. For permission to make commercial uses not covered by the license or a relevant legal provision (such as fair use), please contact us.
Please cite to this resource collection as “Brandon L. Garrett and Jon Ashley, Corporate Prosecution Registry, Duke University and University of Virginia School of Law”, at http://lib.law.virginia.edu/Garrett/corporate-prosecution-registry/index.html
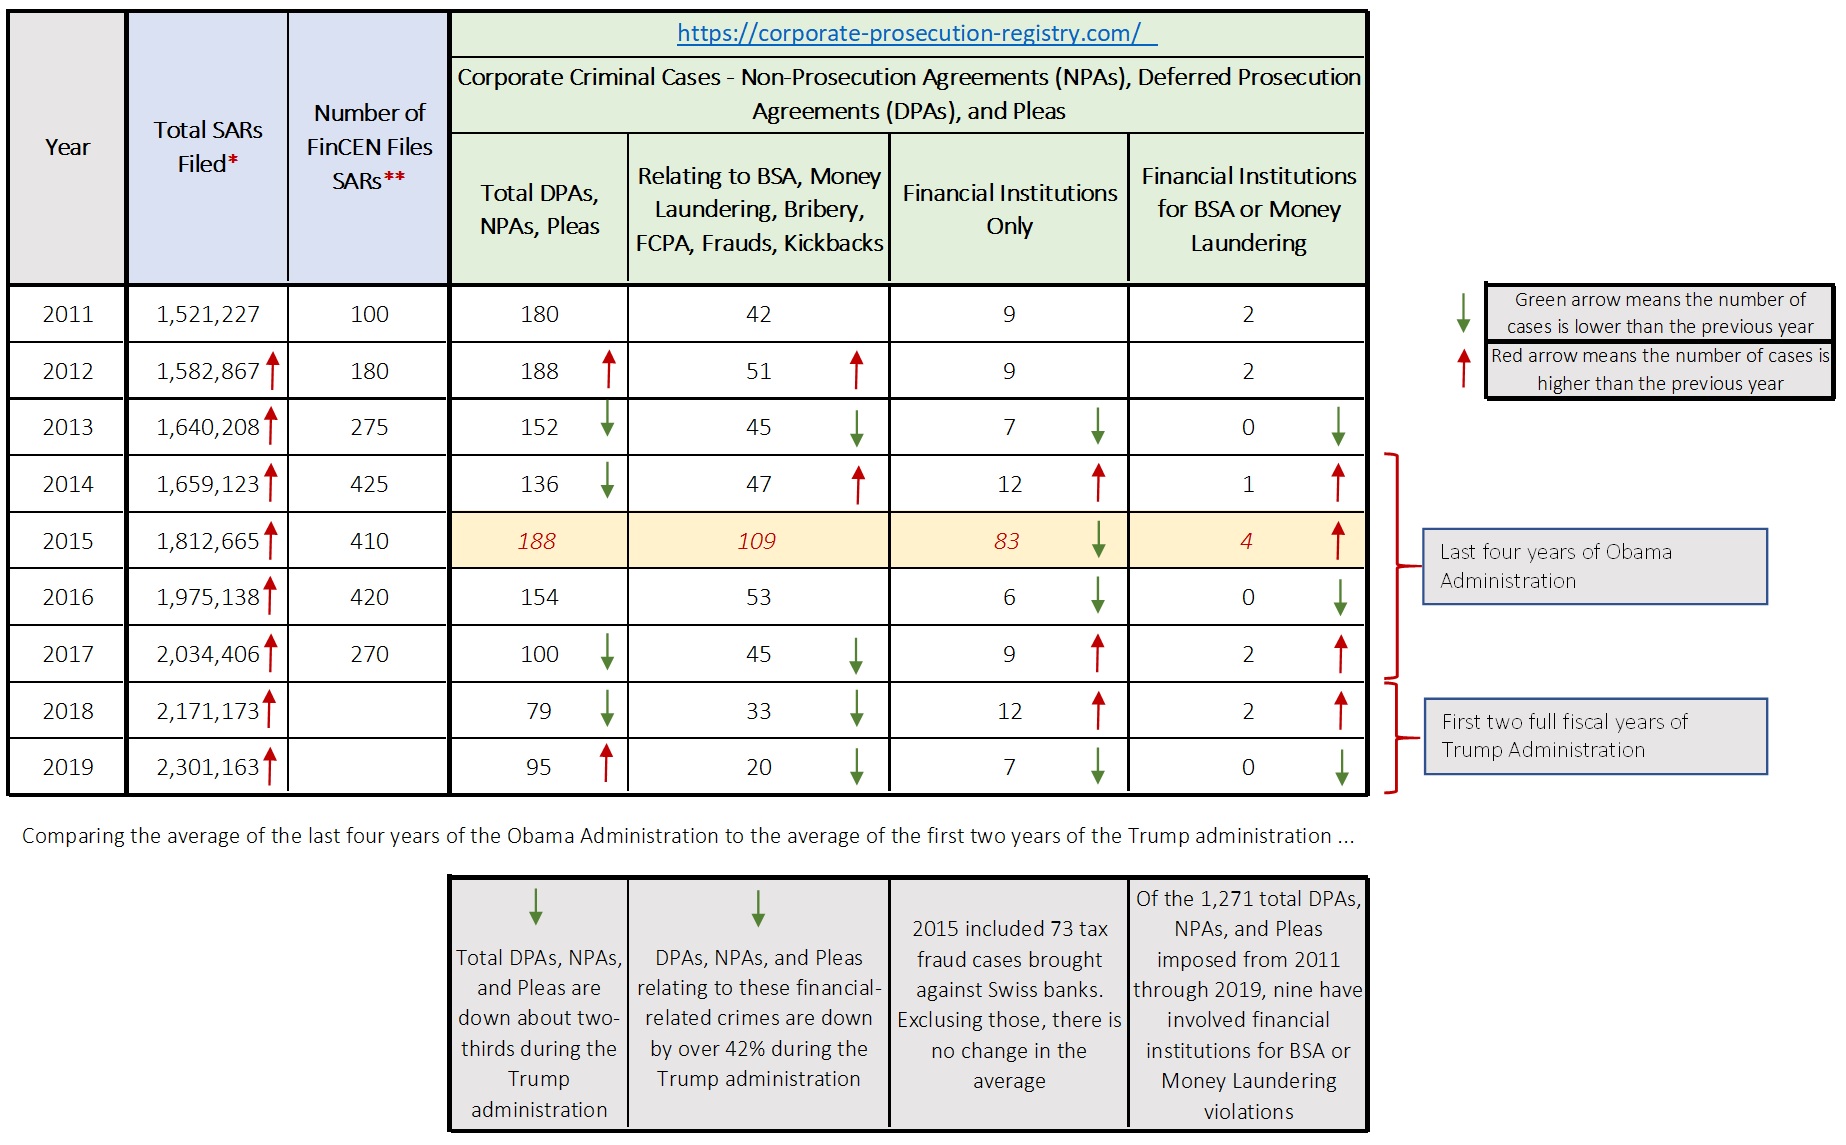
With that introduction, I pulled the data for Deferred Prosecution Agreements (DPAs), Non-Prosecution Agreements (NPAs) and guilty pleas, by year, and then took three sub-sets of that data: (i) DPAs, NPAs, and Pleas relating to six types of offenses (as categorized by the folks at UVA and Duke) that involve financial crimes-related matters (BSA, Money Laundering, Bribery, Foreign Corrupt Practices Act, four types of Frauds, and Kickbacks); (ii) DPAs, NPAs, and guilty pleas of any type by financial institutions; and (iii) DPAs, NPAs, and guilty pleas by financial institutions for BSA of Money Laundering. And as I did with federal criminal cases, I included total SARs filed and FinCEN Files SARs as a comparison.
There are some interesting trends. First, 2015 is an anomaly: it included 73 fraud cases prosecuted against Swiss banks under a program that DOJ ran relating to undisclosed accounts and assets held by U.S. taxpayers.
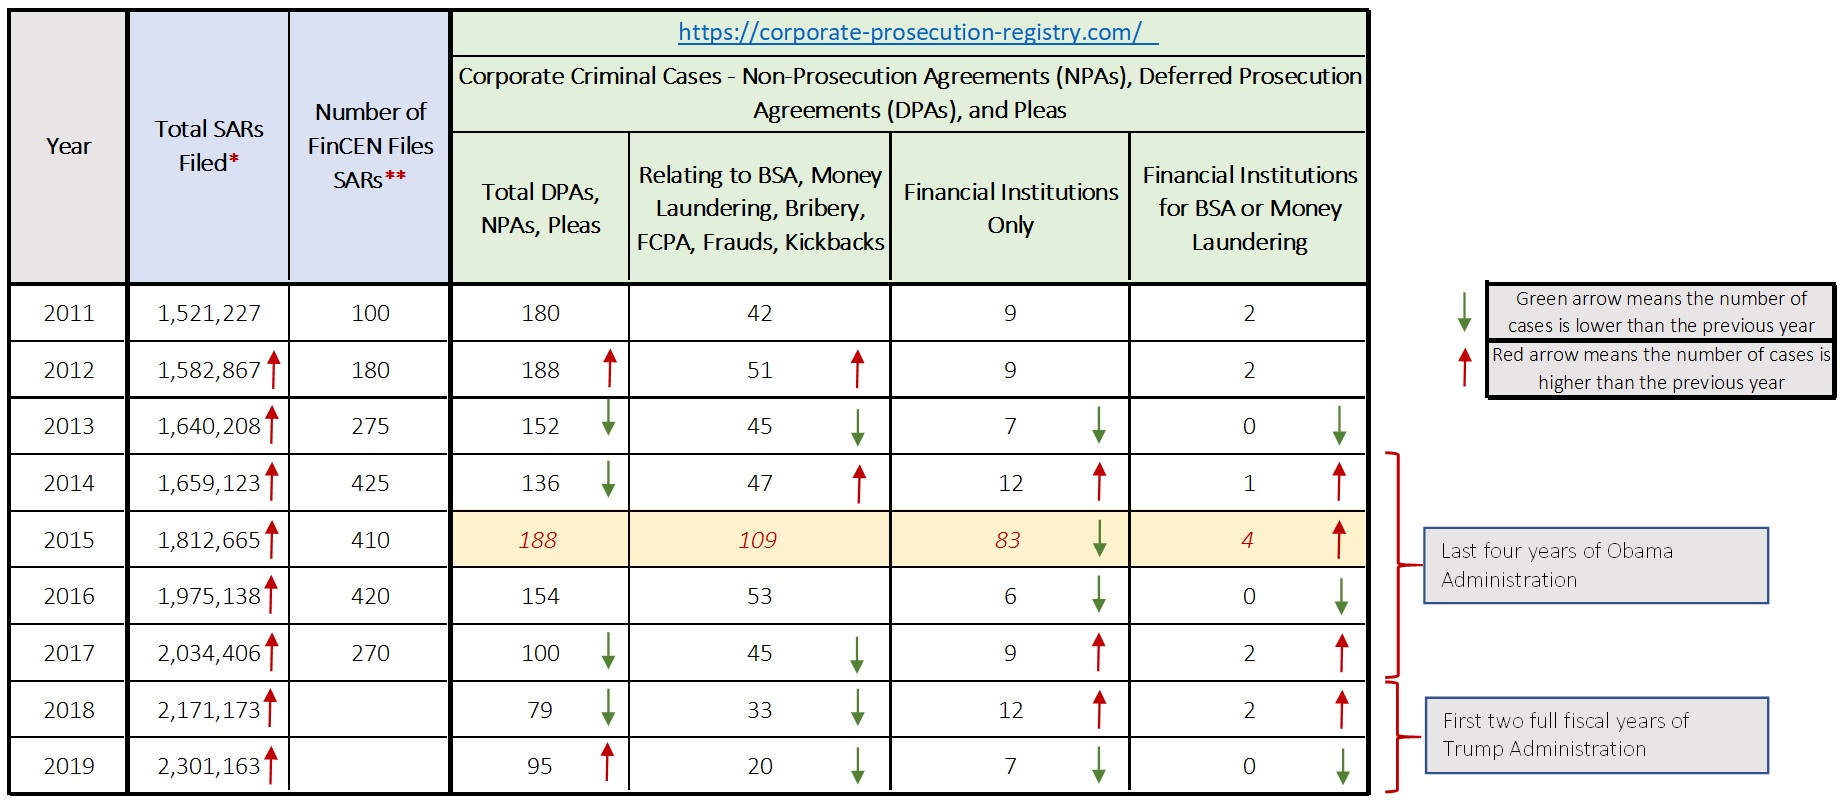
Total DPAs, NPAs, Pleas – the total number of DPAs, NPAs, and guilty pleas has been steadily dropping from 2011 through 2019, but the drop is more pronounced under the Trump administration, where they’re down by about two-thirds compared to the last four years of the Obama administration.
DPAs, NPAs, Pleas for Financial Crimes – Comparing the average of the last four years of the Obama administration with the average of the first two years of the Trump administration, these are down by over 42 percent.
Observation: Comparing the average of the last four years of the Obama administration with the average of the first two years of the Trump administration, total DPAs, NPAs, and guilty pleas, and financial crimes-related DPAs, NPAs, and guilty pleas, against corporations are down by about half.
DPAs, NPAs, and Pleas against Financial Institutions – although the number of financial institutions entering into DPAs, NPAs, and guilty pleas isn’t high – other than the spike from the Swiss bank cases in 2015 it has not exceeded twelve in any year – the percentage of these resolutions involving financial institutions has gone up under the Trump administration (11 percent of all DPAs, NPAs, and pleas) compared to three of the last four years of the Obama administration (7 percent, excluding the anomalous 2015 year).
DPAs, NPAs, and Pleas Entered into by Financial Institutions for BSA and Money Laundering – As seen above, these are rare. In the last nine years (with the exception of the anomalous 2015 year) there has never been more than two of these cases brought against financial institutions. There are 30,000+ financial institutions in the United States: the chances of being prosecuted for BSA or money laundering violations is exceedingly rare.
To summarize:
III. Referrals from Regulatory Agencies to FinCEN
In August 2019 the Government Accountability Office, or GAO, issued a report titled “BSA: Agencies and Financial Institutions Share Information but Metrics and Feedback not Regularly Provided”. It is available at https://www.gao.gov/assets/710/701086.pdf.
Among other things, the GAO looked at FinCEN’s enforcement action authority, and how it obtained information needed to issue enforcement actions. On pages 29 and 30 they described these referral sources as follows:
“FinCEN enforcement actions can be based on sources that include referrals from examining authorities, information from financial institutions, interviews, and leads from law enforcement. Other sources for FinCEN enforcement actions can include FinCEN’s own targeted BSA/AML examinations for high-risk areas and other areas that FinCEN identifies through referrals within FinCEN or through its proactive investigations. Supervisory agencies, including the federal banking regulators, SEC, CFTC, and their respective SROs are to promptly notify FinCEN of any significant potential BSA violations. A significant violation, as established in a memorandum of understanding with each supervisory agency, generally includes systemic BSA/AML compliance program deficiencies or reporting or recordkeeping violation(s); a financial institution’s failure to respond to supervisory warnings concerning such BSA deficiencies or violations; a financial institution’s willful or reckless disregard of BSA requirements; or a violation that creates a substantial risk of money laundering or the financing of terrorism in the institution. IRS also makes referrals to FinCEN for violations it identifies in its BSA examinations, such as willful violations of AML program requirements and recordkeeping and reporting regulations and structuring. Additionally, financial institutions can self-report violations, DOJ or other law enforcement agencies may provide leads, and FinCEN personnel can refer potential violations to FinCEN’s Enforcement Division to be investigated.”
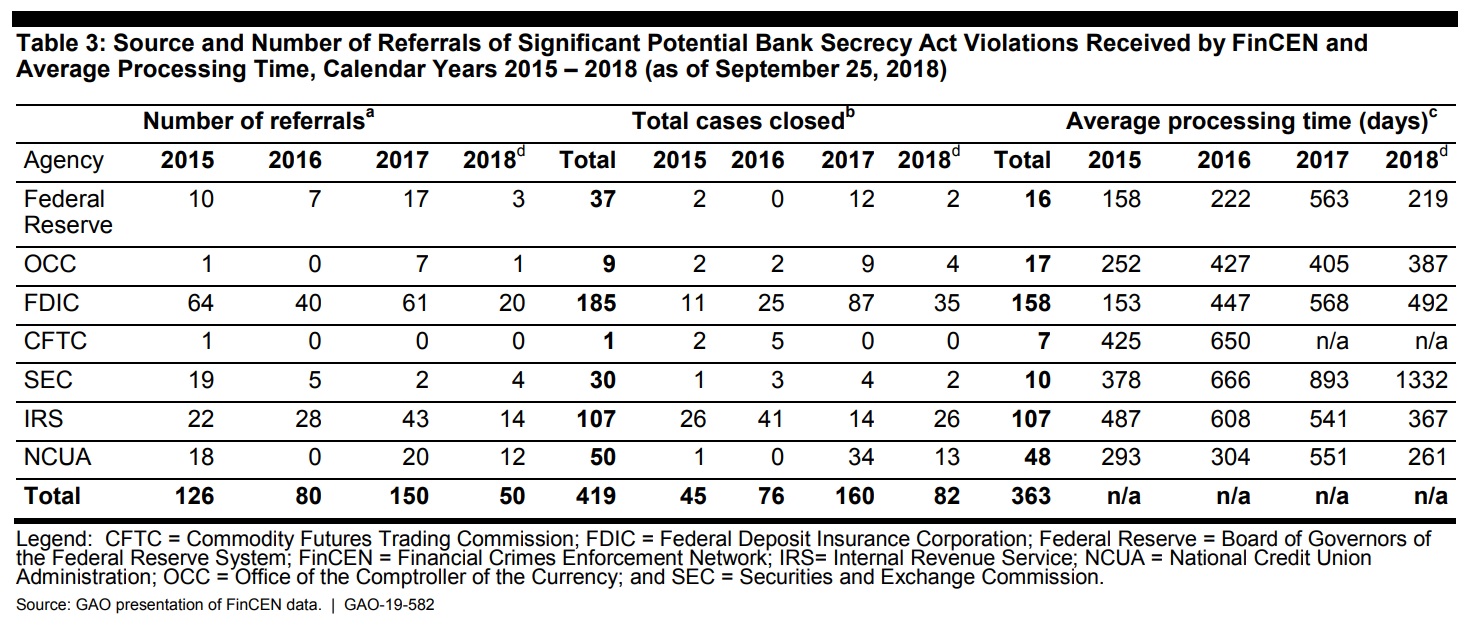
From January 2015 through September 2018, six regulatory agencies (Federal Reserve, OCC, FDIC, CFTC, SEC, NCUA) and the IRS referred 419 significant potential BSA violations to FinCEN. According to the GAO, it took FinCEN between 5 months and 3 years to close a referral case. Below is table 3 from the GAO report summarizing those referrals:
In that same period (2015-2018), FinCEN issued 26 enforcement actions (one in 2019, two in 2020). Here’s what that looks like:
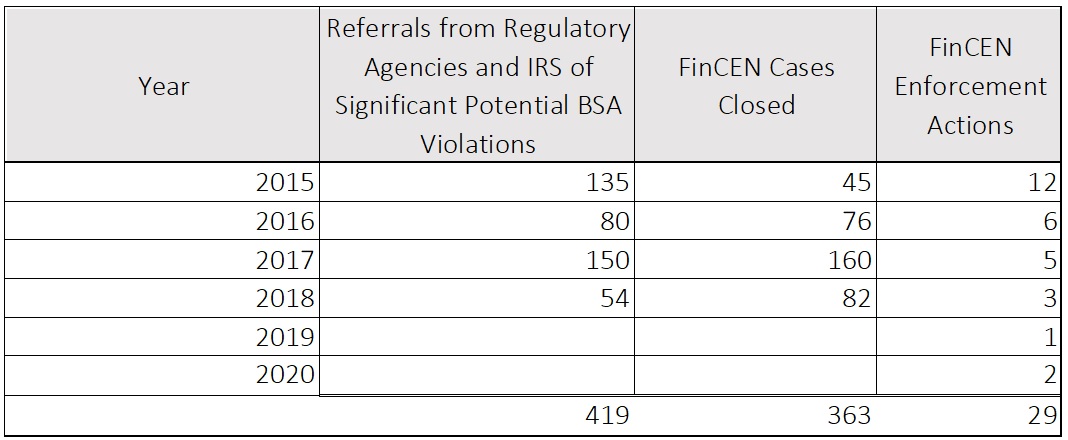
The first trend we can see from this data is that the number of FinCEN enforcement actions dropped every year from a high of twelve in 2015 to a low of one in 2019. Through October 30 there have been two FinCEN enforcement actions issued in 2020, and both have been against individuals: Michael LaFontaine, former chief risk officer of US Bank, and Larry Dean Harmon, who operated an unlicensed money service business (a crypto exchange and mixer).
This data also reveals something that is not about a trend or a comparison between political administrations, but is about the outcomes from the agency referrals. Given the 5 month to three year lag in closing cases, we can assume (generously) that a referral made in 2015 wouldn’t be closed (and an enforcement action either doesn’t result or does result from the closed case) until at least 2016. So most of the 135 referrals from 2015 would be part of the 76 or even 180 closed cases in 2016 and 2017. But it would be fair to assume that the 419 referrals from 2015 through 2018 were resolved between 2016 and 2020. With that assumption,
96 percent or more of regulatory agencies’ referrals of significant potential BSA violations do not result in a FinCEN enforcement action: that is a 96 percent “false positive” rate!
I write “96 percent or more” because agency referrals, as explained by the GAO, are only one source of potential FinCEN enforcement actions: financial institutions can self-report issues, the DOJ can make referrals, and FinCEN, of course, has the ability to source its own cases. So 96 percent is conservative: it is likely closer to 98 percent.
Everyone in the industry, and everyone commenting on the industry, bemoans the terrible false positive rate of traditional transaction monitoring systems. Experts and enthusiasts alike write and talk about the 95 percent false positive rate – where only 5 of 100 alerts that are generated end up being reported in a Suspicious Activity Report, or SAR. Leaving aside the sloppiness of the description – alerts are not reported in SARs, suspicious activity is reported in SARs – and the axiomatic and anecdotal nature of the complaints, it is fair to say that traditional transaction monitoring systems are neither effective nor efficient, and a 95 percent false positive rate, on average, may not be too far off reality. It is, at least, a useful talking point and an anchoring number we can use as we strive to lower that rate to something better. I have written about this at length. See, for example, https://regtechconsulting.net/uncategorized/the-current-bsa-aml-regime-is-a-classic-fixer-upper-and-heres-seven-things-to-fix/.
But it is certainly interesting, even if only for conversational purposes, if FinCEN itself also suffers from a 95 percent false positive rate when it comes to converting agency referrals of “significant potential BSA violations” to its version of a SAR, an enforcement action.
Conclusion
When we wake up on November 4th (although it could take longer, and technically some states are not required to certify their votes until early December) we will either have a new Democratic administration under former Vice-President Joe Biden, or the current Republican administration under President Donald Trump will remain for another four years. Looking at trends in criminal cases against both individuals and corporations (with the latter represented by Deferred and Non-Prosecution Agreements), and trends in enforcement actions brought by FinCEN, we can expect real differences between a Biden administration – more financial crimes-related cases and enforcement actions – and a Trump administration – less. Regardless of the incoming administration, though, we should probably take a closer look at the referrals being made by the regulatory agencies to FinCEN, and how FinCEN is managing them (five months to three years to make a decision on a referral) and closing them: 95 percent “false positives” is inefficient and ineffective in the public sector as well as the private sector.